Call Center Reports and Statistics
Table of Contents
Prerequisites: Call Center Reporting Stats Grid Call Center Reports Queue Stats Stats Available by Call Queue Agent Stats Agent Availability Stats Available by Agent DNIS Stats Stats Available by DNIS (Dialed Number) Abandoned CallsPrerequisites:
- A user scope of Call Center Supervisor or higher
This article covers the call center statistics grid and the dynamic reporting features. It does not cover email reports. If you need information about Call Center Email Reporting, please visit this article: Call Center Report Emails .
Call Center Reporting Stats Grid
A color-coded stats grid shows the following information:
- Green = value accepted.
- Yellow = value is within the range of your lower threshold.
- Red = value that meets or exceeds your upper threshold.
- White = no thresholds are configured for the statistic.

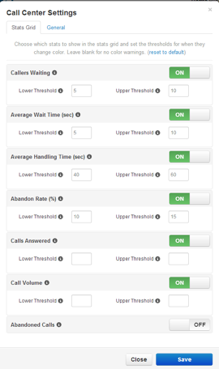
To edit the stats grid:
- Click the Settings button above the stats grid. The Call Center Settings page appears, with the Stats Grid tab displayed.
- Configure the Lower and Upper Thresholds for the statistics you want to show on the stats grid.
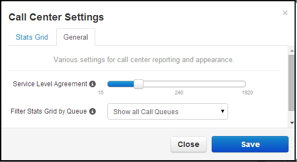
- Click the General tab.
- Use the Service Level Agreement slider to specify a value that will be used to calculate the Service Level Percentage statistic. This value determines whether a call was answered in an acceptable amount of time (seconds).
- You can filter the Stats Grid by Queue to determine whether it is shown for all call queues or one specific call queue.
- Click Save.
Call Center Reports
The Portal can generate custom reports about call queues. These reports provide a graphical overview of call center statistics over a given period of time. The reports can cover the entire call center, queues, or individual agents. This granularity enables call center supervisors to monitor their call center.
To generate call center reports:
- On the Call Center page, click the Reports tab.
- Select a date range.
- Use the Type drop-down list to select the type of report you want to generate (see the following sections for more information):
- Queue Stats
- Agent Stats
- Agent Availability
- DNIS (Dialed Number) Stats
- Abandoned
Queue Stats
The Queue Stats report allows supervisors to view specific attributes on a queue-by-queue basis based on user-configurable attributes.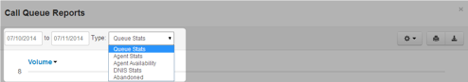
The drop-down list below allows you to select the information appearing on the report.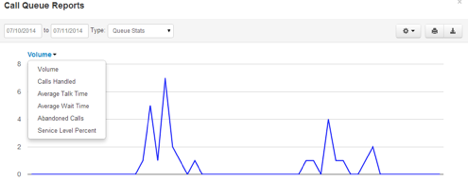
Click the Table Settings gear from the pop-up to change the available configuration fields. When a list of checkboxes appears, check the fields you want to be displayed and uncheck the ones you want to hide.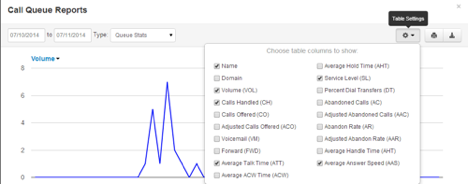
You can now select the statistics you want to include in your report. The available options are described in the table below.
NOTE: You can click the checkboxes in the first column for Call Queue statistics to graph them individually, as shown in the above figure with the different colored rows. Clicking the first column header, which shows the bar graph icon, toggles all the checkboxes on or off.
Stats Available by Call Queue
| Volume (VOL) |
Number of calls originating through a Call Queue. Includes answered calls, abandoned calls, forwards, and voicemail. |
| Calls Handled (CH) | Number of calls answered by agent originating through a Call Queue. |
| Calls Offered (CO) |
Number of calls that reached the queue to be dispatched to agents. Includes abandoned calls. Excludes forwards and voicemail. |
| Adjusted Calls Offered (ACO) |
Adjusted number of calls that reached the queue. Excludes calls abandoned in less than 10 seconds. (Calls Offered CO) - (Adjusted Abandoned Calls AAC). |
| To Vmail | Number of calls handled by the automated voicemail system. |
| Forwarded |
Number of calls forwarded to another queue or off-.net phone number for handling. Includes forwarded calls to voicemail. |
| Avg Talk Time (ATT) |
Average number of minutes spent by agent talking per call on calls originating through a Call Queue. Excludes hold time. |
| Avg After Call Work (ACW) | Average time an agent spends between the end of a call and submitting call disposition. |
| Avg Hold Time (AH) | Average time a caller spends on hold with an agent. Excludes waiting time in the Call Queue. |
| Service Level (SL) | Percentage of calls answered originating through the queue within 60 seconds. Other time windows are available |
| Dial Transfers (DT) | Percentage of calls that landed in the queue and were offered to an agent. |
| Abandoned Calls (AC) | Number of calls that abandoned the queue before being offered to an agent. |
| Adjusted Abandon Calls (AAC) |
Adjusted number of calls that abandoned the queue. Excludes calls abandoned in less than 10 seconds. (Abandoned Calls) - (Number of calls abandoned in less than 10 seconds) |
| Abandon Rate (AR) |
Percentage of calls offered that were abandoned. (Abandoned Calls AC) / (Calls Offered CO). |
| Adjusted Abandon Rate (AAR) |
Percentage of calls offered that were abandoned in under 10 seconds. (Adjusted Abandoned Calls AAC) / (Adjusted Calls Offered ACO). |
| Avg Handle Time (AHT) |
Average time an agent spent on a call. Includes Talk Time (TT), Hold Time (AH), and Disposition Time (ACW) |
| Avg Wait Time (AWT) | Average time a call is in the queue before being dispatched to an agent. |
Agent Stats
The Agent Stats report shows various agent statistics over time.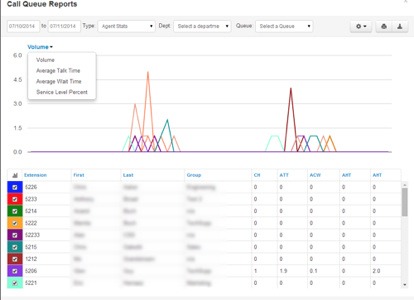
NOTE: You can click the checkboxes in the first column for Call Queue statistics to graph them individually, as shown in the above figure with the different colored rows. Clicking the first column header, which shows the bar graph icon, toggles all the checkboxes on or off.
Agent Availability
The Agent Availability report shows the availability of agents in the domain or in a department within a domain. You choose the values that are to be graphed from the following options: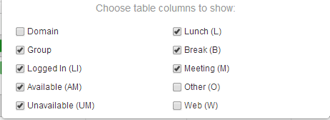
When configured, and when agents have been signing in and out, supervisors can see an agent availability display similar to the following: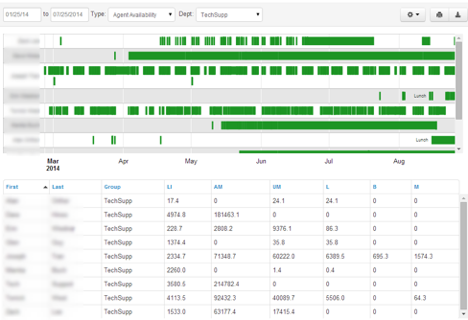
Stats Available by Agent
| Calls Handled (CH) | Number of calls answered by agent originating through a Call Queue. |
| Avg Talk Time (ATT) |
Average number of minutes spent by agent talking per call on calls originating through a Call Queue. Excludes hold time. |
| Avg After Call Work (ACW) | Average time an agent spends between the end of a call and submitting call disposition. |
| Avg Hold Time (AH) | Average time a caller spends on hold with an agent. Excludes waiting time in the Call Queue. |
| Avg Handle Time (AHT) |
Average time an agent spent on a call. Includes Talk Time (TT), Hold Time (AH), and Disposition Time (ACW) |
| Logged in Hours (LI) | Total time an agent status is set to Online. |
| Talking Time(TT) | Number of minutes spent by agent on answered calls originating through a Call Queue |
| Available (AM) |
Total time an agent is available for calls. Includes time Logged In/Online status. Excludes Break, Lunch, Meeting, Unavailable, Web, and Other statuses. |
| Unavailable (UM) |
Total time an agent is not available for calls. Includes time Logged Off/Offline Status, Break, Lunch, Meeting, Web, and Other statuses. Excludes Available. |
| Lunch (L) | Total time an agent status is set to Lunch. |
| Break (B) | Total time an agent status is set to Break. |
| Meeting (M) | Total time an agent status is set to Meeting. |
| The Web (W) | Total time an agent status is set to Web. |
| Other (O) | Total time an agent status is not Available, Break, Lunch, Meeting, or Web. |
| Outbound Attempt (OATT) |
Number of outbound call attempts by agent. Excludes on-net calls and conference calls. |
| Outbound Answered (OANS) |
Number of outbound calls by agent answered by remote party. Includes calls answered by voicemail. Excludes on-net calls and conference calls. |
| Outbound Minutes (OM) |
Number of minutes spent by agent on outbound calls. Excludes call center calls, on-net calls, and conference calls. |
| Outbound Average (OAvg) |
Average length of time spent by agent on outbound calls. Excludes call center calls, on-net calls, and conference calls. |
| Inbound Answered (IANS) |
Number of inbound answered calls to an agent. Includes call center calls. Excludes on-net calls and conference calls. |
| Inbound Minutes (IM) |
Number of minutes spent by an agent on inbound calls. Includes call center calls. Excludes on-net calls and conference calls. |
| Inbound Average (IAVG) |
Average length of time spent by an agent on inbound calls. Includes call center calls. Excludes on-net calls and conference calls. |
| Missed Call (MC) | Number of calls originating through a call queue offered to an agent but not answered. This includes multiple attempts if a call loops through all agents, but excludes unanswered simultaneous ring calls. |
DNIS Stats
The DNIS stats report shows information based on the Dialed Number Identification Service (DNIS). DNIS is a telephone service that informs the receiver about a call that the caller dialled. DNIS is a common feature of 800 and 900 services. If you have multiple 800 or 900 numbers to the same destination, the DNIS tells you which number was called.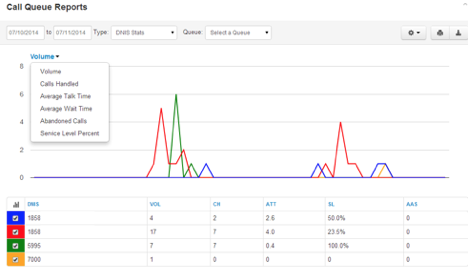
NOTE: You can click the checkboxes in the first column for DNIS statistics to graph them individually, as shown in the above screenshot with the different-colored rows. Also, clicking on the first column header (the bar graph icon) will toggle all of the checkboxes on/off.
Stats Available by DNIS (Dialed Number)
|
Call Volume (VOL) |
Number of calls originating through a Call Queue. Includes answered calls, abandoned calls, forwards, and voicemail. |
| Calls Handled (CH) | Number of calls answered by agent originating through a Call Queue. |
| Calls Offered (CO) |
Number of calls that reached the queue to be dispatched to agents. Includes abandoned calls. Excludes forwards and voicemail. |
| Adjusted Calls Offered (ACO) |
Adjusted number of calls that reached the queue. Excludes calls abandoned in less than 10 seconds. (Calls Offered CO) - (Adjusted Abandoned Calls AAC). |
| To Vmail (VM) | Number of calls handled by the automated voicemail system. |
| Forwarded (FWD) | A number of calls forwarded to another queue or off-net phone number for handling. |
| Avg Talk Time (ATT) |
Average number of minutes spent by agent talking per call on calls originating through a Call Queue. Excludes hold time. |
| Avg After Call Work (ACW) | Average time an agent spends between the end of a call and submitting call disposition. |
| Avg Hold Time (AH) |
Average time a caller spends on hold with an agent. Excludes waiting time in the Call Queue. |
| % Service Level (SL) | Percentage of calls answered originating through the queue within 60 seconds. Other time windows are available. |
| % Dial Transfers (DT) | Percentage of calls that landed in the queue and were offered to an agent. |
| Abandoned Calls (AC) | Number of calls that abandoned the queue before being offered to an agent. |
| Adjusted Abandon Calls (AAC) |
Adjusted number of calls that abandoned the queue. Excludes calls abandoned in less than 10 seconds. (Abandoned Calls) - (Number of calls abandoned in less than 10 seconds) |
| Abandon Rate (AR) |
Percentage of calls offered that were abandoned. (Abandoned Calls AC) / (Calls Offered CO). |
| Adjusted Abandon Rate (AAR) |
Percentage of calls offered that were abandoned in under 10 seconds. (Adjusted Abandoned Calls AAC) / (Adjusted Calls Offered ACO). |
| Avg Handle Time (AHT) |
Average time an agent spent on a call. Includes Talk Time (TT), Hold Time (AH), and Disposition Time (ACW) |
| Avg Answer Speed (AAS) | Average time a call is in the queue before being dispatched to an agent. |
| Available Minutes (AM) |
Total time an agent is available for calls. Includes time Logged In/Online status. Excludes Break, Lunch, Meeting, Unavailable, Web, and Other statuses. |
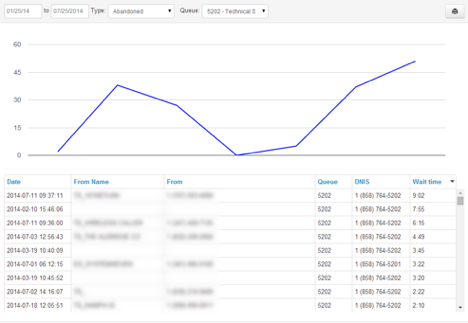
Abandoned Calls
The Abandoned Calls report shows call center graphs for abandoned calls, organized by individual queues. Time is measured along the x-axis, and the number of abandoned calls is measured along the y-axis. All of the abandoned calls for the queue appear below the graph, along with statistics about each individual call.